The average weekly online spend in the UK was £1.0 billion according to the latest ONS figures. That’s an increase of 20.7% compared with February 2016. The amount spent online accounted for 15.3% of all retail spending (excluding petrol) compared with 13.3% in February 2016.
Although February’s figures paint a rosy picture, in reality the underlying three-month picture shows falling sales as February’s figures follow two consecutive months of decline in December and January.
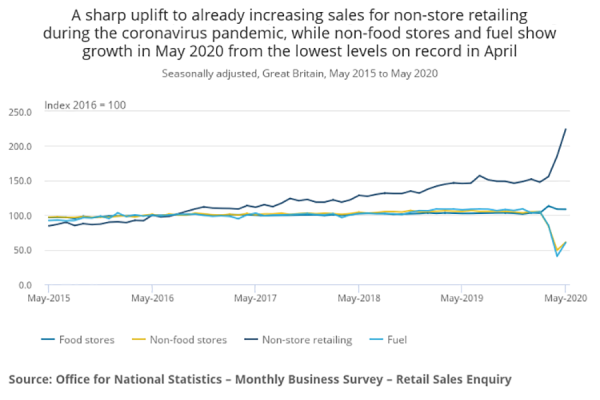
What is interesting, is the stat for non-store retailing (defined as a subset of the retail industry and includes only those retailers that sell predominantly online or through mail order) which includes marketplace sellers. Non-store retailing grew by 26.6% so if you’re not seeing growth of at least a quarter compared to this time last year then you need to ask yourself why not.
The numbers underscore what we already know – pure play internet traders have an advantage over traditional high street retailers, the ONS estimates that retails sales, excluding petrol, rose by 5.1%. Non-food retailing only saw growth in their Internet sales of 15.5% with department stores seeing growth of just 10.4% compared to the mid-twenty percent growth for online retailers.
High street retailers have to focus on growing their online and multichannel offerings. Online only retailers may be happy with mid twenty percent growth, but the opportunity of cross border sales still means that your business should be growing much faster and currently, with the low value of Sterling, British goods are more attractive to overseas buyers than ever.
| All retailing | |||
| All food | |||
| All non-food | |||
| Department stores | |||
| Textile, clothing and footwear | |||
| Household goods | |||
| Other stores | |||
| Non-store retailing | |||
| Source: Monthly Business Survey – Retail Sales Inquiry, Office for National Statistics | |||


