Determining how your business is performing over time is essential in crafting an effective growth strategy. Etsy shop stats generate personalised data illustrating how people find your shop and engage with your listings.
Understand your shop’s performance at a glance
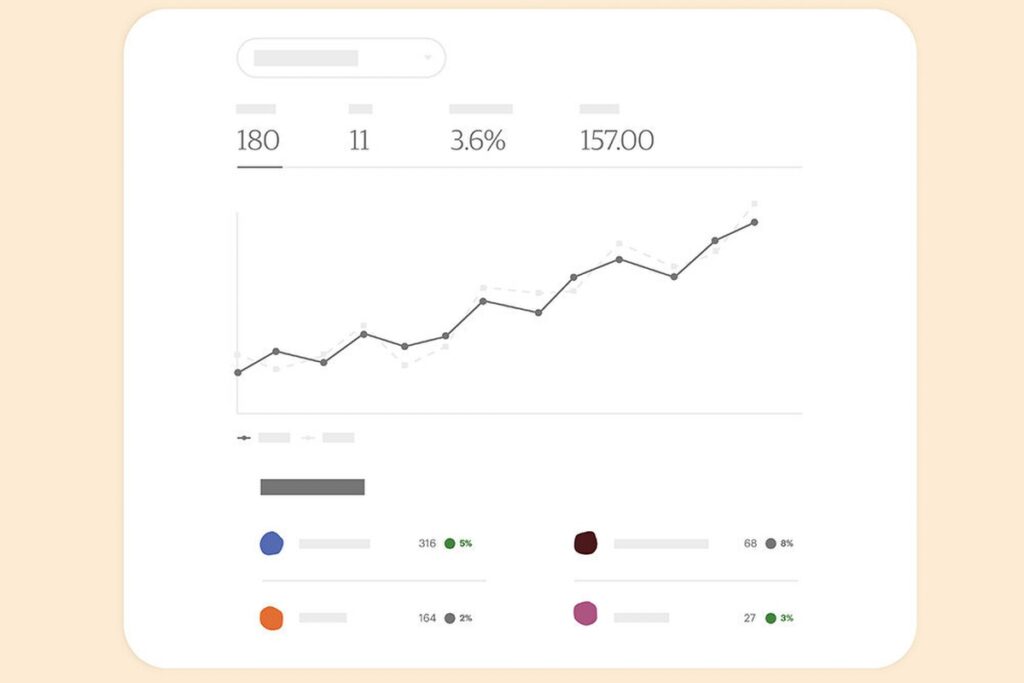
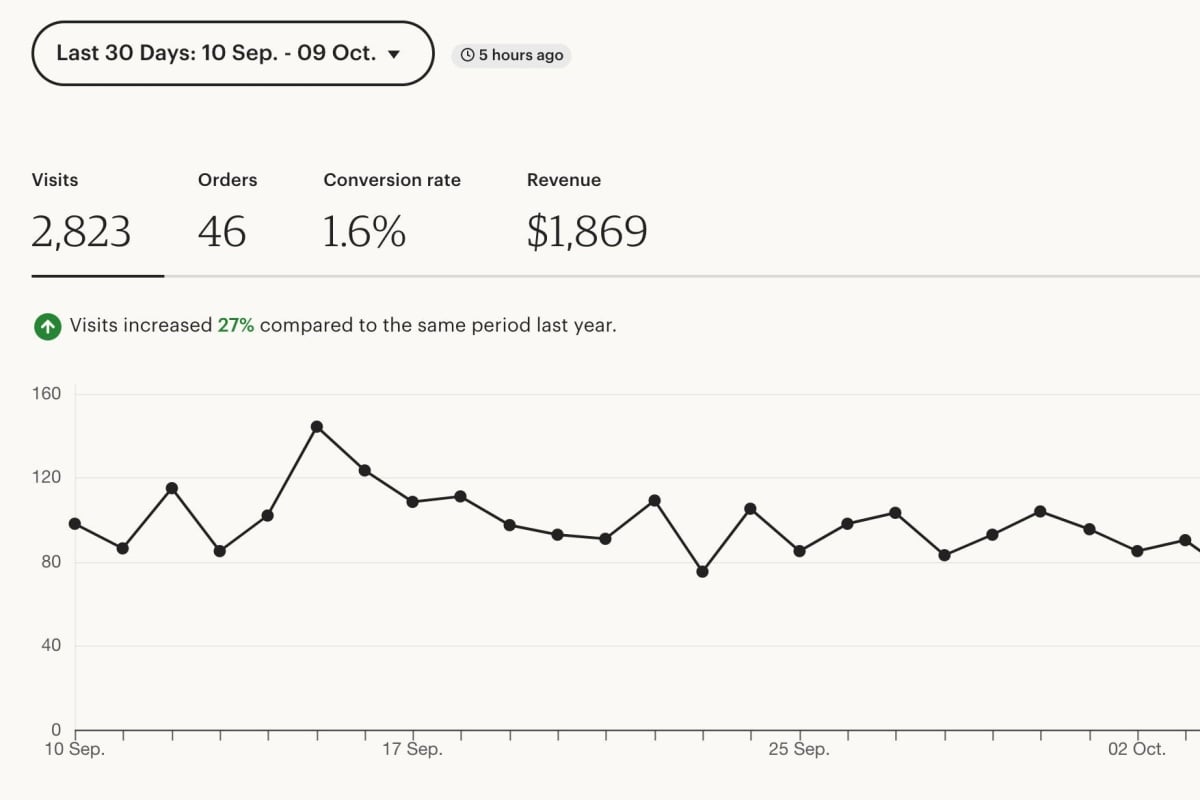
From the Shop Manager, you can find your personalised shop and listing analytics under Stats in the sidebar. The top overview provides a snapshot of your shop’s performance at a glance, along with options to review performance over various periods and helpful clues for where to focus your efforts depending on your business goals.
When looking at your visits and orders, look at least 30 days at a time, instead of today or the past seven days, to get a better sense of the health of your shop. Many shops experience fluctuations in sales from season to season.
Choosing from ranges like last 30 days, this year, or all time, the graph will automatically update to reflect performance over the period, providing a quick visualisation of trends in visits, orders, conversion rate, or revenue.
While the default information presented in this view is a comparison of shop visits, selecting orders, conversion rate, or revenue will reflect that information on the graph. You can find a detailed glossary of the terms used throughout shop stats here.
One important metric relationship to track is your conversion rate, calculated by the ratio between visits and completed orders. Your conversion rate is best measured over longer periods of time and can be informed by a variety of factors, including your product photography, pricing, and other factors like your number of customer reviews and average review rating.
While the global average conversion rate for e-commerce sites is 2.9%, including a wide range of larger online retailers, a “good” conversion rate on Etsy looks different for every shop and varies significantly across categories and price points. In general, sellers should expect a conversion rate between 1–5%.
While your shop is getting up and running, a low conversion rate shouldn’t be cause for alarm. As more traffic comes to your shop, you’ll have more opportunities to increase your conversion rate. Find in-depth tips in create listings that convert.
Take a closer look at how shoppers are finding your shop
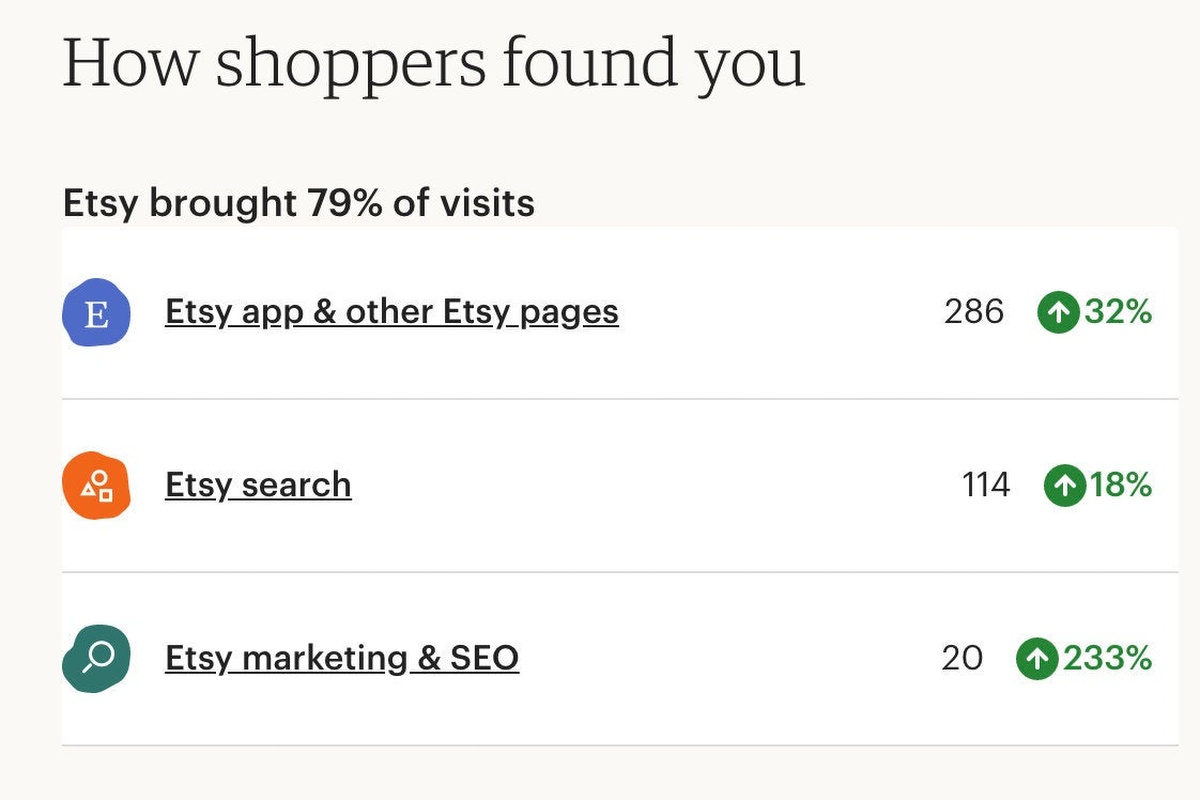
As you scroll down the page, how shoppers found you display internal and external traffic sources that brought visitors to your shop during the period selected. Clicking into each source generates a more granular view of the information available.
By Etsy
Traffic to your shop generated by Etsy is broken down by visits via the Etsy app and other Etsy pages, previously “Other Etsy pages”, and Etsy search. You’ll also see traffic generated by Etsy’s marketing and SEO, was “External search”. This traffic comes from Etsy-funded offsite promotions and search engine optimisations that bring shoppers to your listings.
Updating your keywords, listing-level attributes, listing titles, and descriptions can influence these numbers. Learn more about optimising your listings in the Ultimate Guide to Etsy Search.
By you
The traffic you brought to your shop independently includes Direct and other traffic links, previously “Other”, from things like blogs, news sites, and other websites. In this section, you’ll also see visits generated from each social media channel, including Instagram, Pinterest, Facebook, Twitter, and Tumblr, and traffic generated by Etsy Ads.
Deep dive into listing-level engagement
The average number of listings viewed per shopper can provide a helpful sense of how engaged shoppers are with your broader shop offerings, from your range of products to the overall branding and aesthetic of your shop page. Learn more about introducing tiered product offerings that can help increase this number here.
As you review the performance of individual listings, consider promoting your most popular listings in your marketing on social media or elsewhere. Buyers visit your top viewed listings for a reason. You can use that information to turn those visits into sales. You may consider retiring or revamping items that have very low views or sales, so you can focus your energy on your top performers.
Every shop’s goals and the path to achieving them is unique. Once you have a sense of how your shop is performing, decide which metrics you’d like to impact, set numerical goals, and begin experimenting. Reviewing changes in your stats every two weeks or so will help you keep track of your progress along the way.
